
By Andrey Sorokin, Alexander Kasheverov, Alexey Chernyshev
(Editor’s Note: You can learn more about Voronezh in this nice video about the city, and of course on Wikipedia. Diversity is important to innovation, and this weblog describes a winning network-focused hack. Innovation is everywhere!)
Introduction
Often high buildings around the cell subscriber or the subscriber’s distant position from the base station can be a cause of poor radio signal for the mobile equipment. In addition, the number of subscribers for each certain cell area dedicated to certain base station can limit the signal quality for voice and packet traffic. Moreover, the reason for call drops or total radio signal loss may be associated with the wrong parameters configured for handover procedures (wrong radio frequency characteristics, the absence of the dedicated neighboring cell for certain Base Stations) on the cell operator side.
The signal parameters, presence of neighboring cells, as well as geolocation can be collected and processed by specific applications for mobile devices. For example, there are a lot of ‘GSM Signal Monitor’-type applications available for Google Play and the AppStore. The network monitoring applications allows to monitor the state of the mobile communication network through the collection of current and neighboring cells data, as well as absolute signal strength units (ASU), GPS coordinates. Such applications can be used for GSM, UMTS and LTE networks (in case the radio module of the device supports them).
The Base Use Case for network monitoring application
After the application is launched the procedure of network analysis will be launched – a device radio module will scan all neighboring cells available for certain GPS area, radio frequency parameters, ASU. This data is displayed in the app’s UI. All information populated on the UI generates the so-called Cell Global Identity (CGI), i.e. “Global cell ID.” CGI is used to mark and identify of a particular cell within the operator’s coverage area. In this case the CGI cell coverage area adjacent to the parent BS can be calculated. CGI consists of the following information: MCC (Mobile Country Code) – the country code; MNC (Mobile Network Code) – code of the mobile operator; Location
Area Code (LAC) – the code the location of the current base station, each country has its own area. Strictly speaking, LAC is not always corresponds the certain region – for a particular cell operator there can be several LAC areas in the same city and in the case of global area – a few hundred of LAC can be supported. In addition, the application collects the CID – the identifier of the current cell, which at the moment the cell phone is attached to. In fact, this is the number of the nearest base station, through which calls and other operations can be processed.
Moreover, the application can determine the type of connection available network service connections (GPRS / EDGE / UMTS / HSPA / HSDPA / HSUPA) and, of course, the level of cell signal in dBm – specific value of the network signal power given by 1 mW. (A negative value – the bigger it is, then better the quality of the signal; the signal level may fluctuate in the range of -113 dBm (weak signal) to -50 dBm (strong signal)). In most cases the devices GSM module operates with ASU value that can be converted to dBm.
Cell Network Monitor & KPI Analyzer POC
In fact, the data that can be collected from the GSM module for certain mobile device is one of the main KPI (Key Performance Indicator) that can be used by cell operators. For example, the KPIs of a successful handover, unsuccessful connections (caused by bad signal quality or drop zones), packet metrics (packet handovers for subscribers’ connections when surfing the Internet, as well as the inability to establish a packet connection for the device) are commonly used by cell operators. But still these KPIs can be collected in case of statistics for certain cell, so the analysis can be unreliable. We assume that the basic KPIs collected by network monitoring application from the GSM module of the certain devices can be analyzed for certain areas and the passed to the cell operator for global analysis.
Thus, for the network monitoring application, the main feature is the ability to login events for unsuccessful handover during the voice calls / data connection parameters measuring, monitoring the poor performance of the radio signal, count the failed voice/packet connections, and all this with reference to a specific geolocation. All this information can be structured in the report, and directly provided to the cell operator through a stable USSD channel as USSD report for the data export. Please note that in USSD data transfer case the subscriber does not have to pay anything, and integration with the USSD platform of cell operator will improve KPI monitoring procedure of the cell network – the cell operator will be provided with online events statistics and the passive monitoring of the cell network by means the proposed application installed on the cell operator’s subscribers’ devices.
Of course it requires the development of a parser for the USSD platform on the side of the cell operator, but on the other hand, it is an excellent tool not only to develop an application, but also to create a new API for integration with SMS / USSD platform for telecom operators.
However, during the TADHack 2016 our team was not able to develop the demo environment for USSD data transfer case.
We’ve used the Android SDK to develop a listener event driven Android application installed on the field test device. The data transfer was organized via cell operators packet connection.

Backend implementation was based on java technology stack and extensively uses AWS ecosystem for events persistence and analysis. Data from Android application is transferred to DynamoDB directly which provides write operation throughput scalability. Each event registered in DynamoDB table instance triggers a lambda function execution. The later transfers event data copy to Amazon Kinesis input stream, then Amazon Kinesis analytics come into play by filtering out the most critical events: signal level peak increase, decrease, service unavailable, base station handover. The found critical events are downstreamed to S3 bucket and to DynamoDB isolated table.
API at the moment is pretty straightforward and includes the following endpoints:
GET /accounts – returns list of all cell accounts in the system
GET /data?from=<from>&to=<to> – returns all registered events within specified datetime frame [from,to]
GET /data/analyzed?from=<from>&to=<to>&type=<type>&state=<state> – returns all critical events within specified datetime frame [from, to], where
type is one of:
HANDOVER
NO_SERVICE
SIGNAL_PEAK_DECREASE
SIGNAL_PEAK_INCREASE
state is one of:
IDLE,
OFFHOOK
RINGING
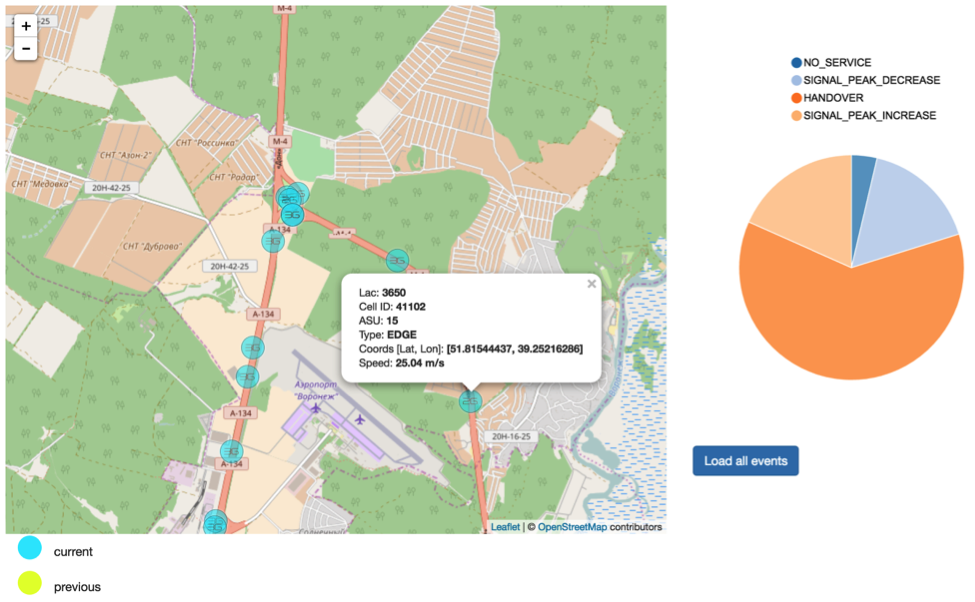
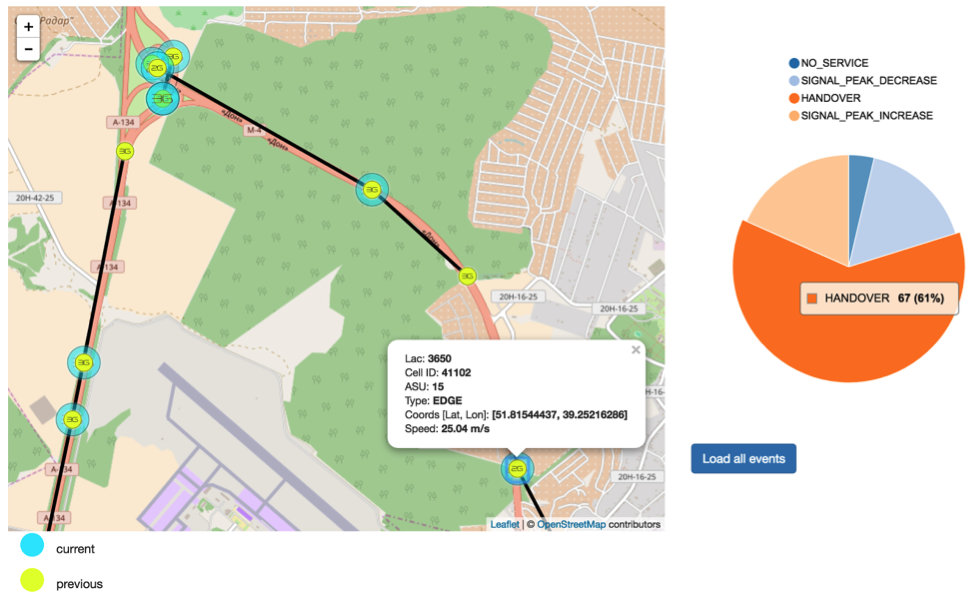
The field test results that can be provide to cell network operators is developed as the Web Page Dashboard front-end application that was based on Angular 1. There are nvd3 (for a chart) and leaflet (for a map) angular modules. The certain data was requested from API using the resource module and then everything was rendered on a page. The app handles clicks on chart’s segments and redraw of the map.